The sampling distribution is a theoretical distribution of a sample statistic. While the concept of a distribution of a set of numbers is intuitive for most students, the concept of a distribution of a set of statistics is not. Therefore distributions will be reviewed before the sampling distribution is discussed.
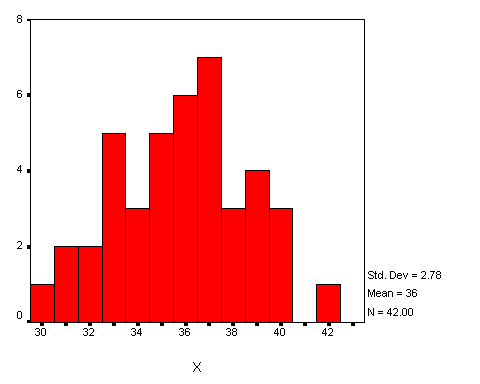
The sample distribution is the distribution resulting from the collection of actual data. A major characteristic of a sample is that it contains a finite (countable) number of scores, the number of scores represented by the letter N. For example, suppose that the following data were collected:
| 32 | 35 | 42 | 33 | 36 | 38 | 37 | 33 | 38 | 36 | 35 | 34 | 37 | 40 | 38 | 36 | 35 | 31 | 37 | 36 | 33 |
| 36 | 39 | 40 | 33 | 30 | 35 | 37 | 39 | 32 | 39 | 37 | 35 | 36 | 39 | 33 | 31 | 40 | 37 | 34 | 34 | 37 |
These numbers constitute a sample distribution. Using the procedures discussed in Chapter 5, "Frequency Distributions," the following histogram can be constructed to picture this data:
In addition to the frequency distribution, the sample distribution can be described with numbers, called statistics. Examples of statistics are the mean, median, mode, standard deviation, range, and correlation coefficient, among others. Statistics, and procedures for computing statistics, were discussed in detail in an earlier chapters.
If a different sample were taken, different scores would result. The relative frequency polygon would be different, as would the statistics computed from the second sample. However, there would also be some consistency in that while the statistics would not be exactly the same, they would be similar. To achieve order in this chaos, statisticians have developed probability models.
Probability models exist in a theoretical world where complete information is available. As such, they can never be known except in the mind of the mathematical statistician. If an infinite number of infinitely precise scores were taken, the resulting distribution would be a probability model of the population.
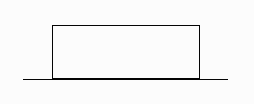
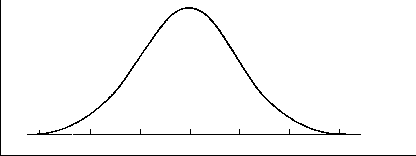
The probability model may be described with pictures (graphs) which are analogous to the relative frequency polygon of the sample distribution. The two graphs below illustrate two types of probability models, the uniform distribution and the normal curve.
As discussed earlier in Chapter 9, "The Normal Curve," probability distributions are described by mathematical equations that contain parameters. Parameters are variables that change the shape of the probability model. By setting these parameters equal to numbers, a member of that probability model family of models results.
A critical aspect of statistics is the estimation of parameters with sample statistics. Sample statistics are used as estimators of the corresponding parameters in the population model. For example, the mean and standard deviation of the sample are used as estimates of the corresponding population parameters m and d. Mathematical statistics texts devote considerable effort to defining what is a good or poor parameter estimation procedure.
Note the "-ing" on the end of sample in sampling distribution. It looks and sounds similar to the sample distribution but, in reality the concept is much closer to a population model.
The sampling distribution is a theoretical distribution of a sample statistic. It is a model of a distribution of scores, like the population distribution, except that the scores are not raw scores, but statistics. It is a thought experiment. "What would the world be like if a person repeatedly took samples of size N from the population distribution and computed a particular statistic each time?" The resulting distribution of statistics is called the sampling distribution of that statistic.
For example, suppose that a sample of size sixteen (N=16) is taken from some population. The mean of the sixteen numbers is computed. Next a new sample of sixteen is taken, and the mean is again computed. If this process were repeated an infinite number of times, the distribution of the now infinite number of sample means would be called the sampling distribution of the mean.
Every statistic has a sampling distribution. For example, suppose that instead of the mean, medians were computed for each sample. The infinite number of medians would be called the sampling distribution of the median.
Just as the population models can be described with parameters, so can the sampling distribution. The expected value (analogous to the mean) of a sampling distribution will be represented here by the symbol m (mu). The m symbol is often written with a subscript to indicate which sampling distribution is being discussed. For example, the expected value of the sampling distribution of the mean is represented by the symbol
![]() that of the median by
that of the median by
![]() , and so forth. The value of
, and so forth. The value of
![]() can be thought of as the mean of the distribution of means. In a similar manner the value of
can be thought of as the mean of the distribution of means. In a similar manner the value of
![]() is the mean of a distribution of medians. They are not really means, because it is not possible to find a mean when N=¥
, but they are the mathematical equivalent of a mean.
is the mean of a distribution of medians. They are not really means, because it is not possible to find a mean when N=¥
, but they are the mathematical equivalent of a mean.
Using advanced mathematics, in a thought experiment, the theoretical statistician often discovers a relationship between the expected value of a statistic and the model parameters. For example, it can be proven that the expected value of both the mean and the median, ![]() and Md, is equal to
and Md, is equal to
![]() . When the expected value of a statistic equals a population parameter, the statistic is called an unbiased estimator of that parameter. In this case, both the mean and the median would be an unbiased estimator of the parameter
. When the expected value of a statistic equals a population parameter, the statistic is called an unbiased estimator of that parameter. In this case, both the mean and the median would be an unbiased estimator of the parameter
![]() .
.
A sampling distribution may also be described with a parameter corresponding to a variance, symbolized by
![]() . The square root of this parameter is given a special name, the standard error. Each sampling distribution has a standard error. In order to keep them straight, each has a name tagged on the end of "standard error" and a subscript on the d symbol. The standard deviation of the sampling distribution of the mean is called the standard error of the mean and is symbolized by
. The square root of this parameter is given a special name, the standard error. Each sampling distribution has a standard error. In order to keep them straight, each has a name tagged on the end of "standard error" and a subscript on the d symbol. The standard deviation of the sampling distribution of the mean is called the standard error of the mean and is symbolized by
![]() . Similarly, the standard deviation of the sampling distribution of the median is called the standard error of the median and is symbolized by
. Similarly, the standard deviation of the sampling distribution of the median is called the standard error of the median and is symbolized by
![]() .
.
In each case the standard error of a statistic describes the degree to which the computed statistics will differ from one another when calculated from sample of similar size and selected from similar population models. The larger the standard error, the greater the difference between the computed statistics. Consistency is a valuable property to have in the estimation of a population parameter, as the statistic with the smallest standard error is preferred as the estimator of the corresponding population parameter, everything else being equal. Statisticians have proven that in most cases the standard error of the mean is smaller than the standard error of the median. Because of this property, the mean is the preferred estimator of
![]() .
.
The sampling distribution of the mean is a distribution of sample means. This distribution may be described with the parameters
![]() and
and
![]()
These parameters are closely related to the parameters of the population distribution, with the relationship being described by the Central Limit Theorem. The Central Limit Theorem essentially states that the mean of the sampling distribution of the mean (
![]() ) equals the mean of the population model (
) equals the mean of the population model (
![]() and that the standard error of the mean (
and that the standard error of the mean (
![]() equals the standard deviation of the population model (
equals the standard deviation of the population model (
![]() ) divided by the square root of N as the sample size gets infinitely larger (N-> ¥). In addition, the sampling distribution of the mean will approach a normal distribution. The following equations summarize these relationships:
) divided by the square root of N as the sample size gets infinitely larger (N-> ¥). In addition, the sampling distribution of the mean will approach a normal distribution. The following equations summarize these relationships:
The astute student probably noticed, however, that the sample size would have to be very large (¥) in order for these relationships to hold true. In theory, this is fact; in practice, an infinite sample size is impossible. The Central Limit Theorem is very powerful. In most situations encountered by behavioral scientists, this theorem works reasonably well with an N greater than 10 or 20. Thus, it is possible to closely approximate what the distribution of sample means looks like, even with relatively small sample sizes.
The importance of the Central Limit Theorem to statistical thinking cannot be overstated. Most of hypothesis testing and sampling theory is based on this theorem. In addition, it provides a justification for using the normal curve as a model for many naturally occurring phenomena. If a trait, such as intelligence, can be thought of as a combination of relatively independent events, in this case both genetic and environmental, then it would be expected that the trait would be normally distributed in a population.
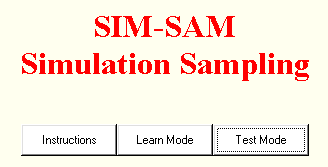
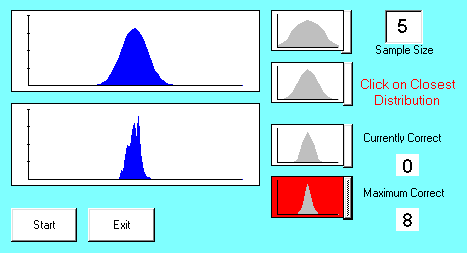
The purpose of the microcomputer simulation exercise SIM-SAM is to demonstrate how a sampling distribution is created. The following figure shows the opening screen:
Although it is possible to skip directly to the test mode, you should spend some time familiarizing yourself in the Learn Mode.
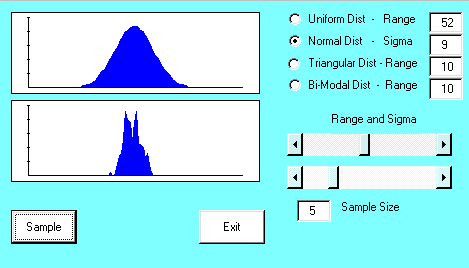
The Learn Mode screen appears as:
To run a simulation, select a distribution, a value for either the Range or Sigma, and a sample size and then click the Sample button. Use the scrollbars to change the values for Range, Sigma, and Sample Size. When you click the Sample button, the computer generates 100 samples of the sample size selected, computes the mean for each sample, and then draws the sampling distribution of the mean below the population model. You should verify that the sampling distribution changes as a function of the type of population model, the variability of the population model, and the sample size. In addition, verify that the shape of the sampling distribution of the mean approaches a normal distribution as the sample size increases no matter what the population model looks like.
When you understand and are comfortable with SIM-SAM's Learn Mode, click Exit and proceed to the Test Mode. The Test Mode screen looks like this:
On each trial, you are presented with a population model and a sample size. You must guess which of the four potential sampling distributions will be closest to the sampling distribution of the mean that is generated by the computer. Click the button next to the graph you select, and the computer will generate 100 samples, compute the mean for each sample, draw the sampling distribution of the mean in the labeled box, and compare the observed sampling distribution of the mean with each of the four possibilities. Using a measure of "goodness of fit", the computer will select the distribution that is closest to the actual distribution. If that distribution is the one that you selected, both the trial counter and the correct counter will be incremented by one; if not, only the trial counter will be incremented.
The number of points given in this assignment will be the number appearing in the "Maximum Correct" box with a maximum of eight. When you are satisfied with the score click on Exit and Update Score.
The sampling distribution, a theoretical distribution of a sample statistic, is a critical component of hypothesis testing. The sampling distribution allows the statistician to hypothesize about what the world would look like if a statistic was calculated an infinite number of times.
A sampling distribution exists for every statistic that can be computed. Like models of relative frequency distributions, sampling distributions are characterized by parameters, two of which are the theoretical mean and standard deviation. The theoretical standard deviation of the sampling distribution is called the standard error and describes how much variation can be can be expected given certain conditions are met, such as a particular sample size.
Of considerable importance to statistical thinking is the sampling distribution of the mean, a theoretical distribution of sample means. A mathematical theorem, called the Central Limit Theorem, describes the relationship of the parameters of the sampling distribution of the mean to the parameters of the probability model and sample size. The Central Limit Theorem is the theoretical foundation of the gaming industry and insurance companies. The Central Limit Theorem is also the foundation for hypothesis tests that measure the size of the effect using means.